| Module | visualization |
| Source | https://bit.ly/3v75NGQ |
| Description | Visualizes loss curves and convolutional layers for MesoNet variants |
| Import | import mesonet.visualization |
| Depends on | mesonet.model |
Jump To
Core Functions
plot_loss_curve(history)
Function to plot training and validation loss of a trained model.
It uses matplotlib.pyplot to plot the training and validation losses against the number of epochs on the same graph.
The generated curve looks like this:

| Arguments | |
|---|---|
history | History instance: History of the model. |
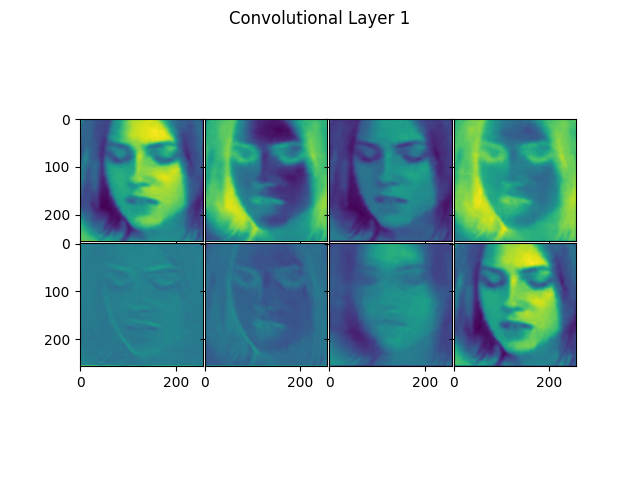
visualize_conv_layers(model, imgs, conv_idx)
Function to visualize specified convolutional layers for given images.
It take a Numpy array of images and a list of indices of convolutional layers, generating plots of the outputs of the layers in the given model for each image. To do this, it uses mesonet.model.get_activation_model().
An example plot is shown below (showing the first layer of one of the pre-trained models):
| Arguments | |
|---|---|
model | tf.keras.Model: Model whose layers are to be visualized. |
imgs | np.array: Images for which the layers are to be visualized. The dimension of the array should be (x, HEIGHT, WIDTH, CHANNELS), where x is the number of images. HEIGHT, WIDTH and CHANNELS should match the inputs for the model. |
conv_idx | list-like: Indices of the convolutional layers to be visualized (0-indexed). The plots will be generated in the order the indices are mentioned. |
Helper Functions
_visualize_conv_layers_single_img(activations, conv_idx)
Function to visualize output of multiple convolutional layers for a single image.
It takes the outputs of the specific convolutional layers for a single image and sequentially generates the plots for each layer. This is the function which actually generates the plots of the layers. It exists only to aide visualize_conv_layers() and you probably won’t need to use it.
| Arguments | |
|---|---|
activations | list-like: Computed outputs of convolutional layers for a image. It should contain Numpy arrays. |
conv_idx | list-like: Indices of the convolutional layers to be visualized (0-indexed). The plots will be generated in the order the indices are mentioned. |